 Web Server Statistics for saanet.ayisagi.org
Program started on Sat, Sep 07 2019 at 12:16 PM.
Analyzed requests from Wed, Jul 26 2017 at 9:18 AM to Fri, Sep 06 2019 at 8:08 PM (772.45 days).
Web Server Statistics for saanet.ayisagi.orgProgram started on Sat, Sep 07 2019 at 12:16 PM.
Analyzed requests from Wed, Jul 26 2017 at 9:18 AM to Fri, Sep 06 2019 at 8:08 PM (772.45 days).
(Go To: Top | General Summary | Monthly Report | Daily Summary | Hourly Summary | Domain Report | Organization Report | Failed Referrer Report | Browser Report | Browser Summary | Operating System Report | Status Code Report | File Size Report | File Type Report | Directory Report | Request Report)
Figures in parentheses refer to the 7-day period ending Sep 07 2019 at 12:16 PM.
Successful requests: 32 (1)
Successful requests for pages: 25 (1)
Failed requests: 5 (0)
Distinct files requested: 10 (12)
Distinct hosts served: 25 (27)
Data transferred: 5.73 kilobytes (22 bytes)
Average data transferred per day: 7 bytes (3 bytes)
(Go To: Top | General Summary | Monthly Report | Daily Summary | Hourly Summary | Domain Report | Organization Report | Failed Referrer Report | Browser Report | Browser Summary | Operating System Report | Status Code Report | File Size Report | File Type Report | Directory Report | Request Report)
Each unit ( ) represents 1 request for a page.
| month | #reqs | #pages | |
|---|---|---|---|
| Jul 2017 | 7 | 0 | |
| Aug 2017 | 0 | 0 | |
| Sep 2017 | 0 | 0 | |
| Oct 2017 | 0 | 0 | |
| Nov 2017 | 0 | 0 | |
| Dec 2017 | 1 | 1 | |
| Jan 2018 | 2 | 2 |  |
| Feb 2018 | 1 | 1 | |
| Mar 2018 | 1 | 1 | |
| Apr 2018 | 1 | 1 | |
| May 2018 | 1 | 1 | |
| Jun 2018 | 1 | 1 | |
| Jul 2018 | 1 | 1 | |
| Aug 2018 | 1 | 1 | |
| Sep 2018 | 1 | 1 | |
| Oct 2018 | 1 | 1 | |
| Nov 2018 | 1 | 1 | |
| Dec 2018 | 1 | 1 | |
| Jan 2019 | 1 | 1 | |
| Feb 2019 | 1 | 1 | |
| Mar 2019 | 1 | 1 | |
| Apr 2019 | 1 | 1 | |
| May 2019 | 1 | 1 | |
| Jun 2019 | 2 | 2 | |
| Jul 2019 | 1 | 1 | |
| Aug 2019 | 2 | 2 | |
| Sep 2019 | 1 | 1 | |
Busiest month: Jan 2018 (2 requests for pages).
(Go To: Top | General Summary | Monthly Report | Daily Summary | Hourly Summary | Domain Report | Organization Report | Failed Referrer Report | Browser Report | Browser Summary | Operating System Report | Status Code Report | File Size Report | File Type Report | Directory Report | Request Report)
Each unit () represents 1 request for a page.
| day | #reqs | #pages | |
|---|---|---|---|
| Sun | 1 | 1 | |
| Mon | 4 | 4 |  |
| Tue | 1 | 1 | |
| Wed | 10 | 3 | |
| Thu | 4 | 4 | |
| Fri | 9 | 9 |  |
| Sat | 3 | 3 | |
(Go To: Top | General Summary | Monthly Report | Daily Summary | Hourly Summary | Domain Report | Organization Report | Failed Referrer Report | Browser Report | Browser Summary | Operating System Report | Status Code Report | File Size Report | File Type Report | Directory Report | Request Report)
Each unit () represents 1 request for a page.
| hour | #reqs | #pages | |
|---|---|---|---|
| 0 | 0 | 0 | |
| 1 | 1 | 1 | |
| 2 | 0 | 0 | |
| 3 | 1 | 1 | |
| 4 | 2 | 2 | |
| 5 | 1 | 1 | |
| 6 | 2 | 2 | |
| 7 | 3 | 3 | |
| 8 | 3 | 3 | |
| 9 | 9 | 2 | |
| 10 | 0 | 0 | |
| 11 | 0 | 0 | |
| 12 | 1 | 1 | |
| 13 | 1 | 1 | |
| 14 | 0 | 0 | |
| 15 | 0 | 0 | |
| 16 | 0 | 0 | |
| 17 | 0 | 0 | |
| 18 | 1 | 1 | |
| 19 | 2 | 2 | |
| 20 | 2 | 2 | |
| 21 | 3 | 3 | |
| 22 | 0 | 0 | |
| 23 | 0 | 0 |
(Go To: Top | General Summary | Monthly Report | Daily Summary | Hourly Summary | Domain Report | Organization Report | Failed Referrer Report | Browser Report | Browser Summary | Operating System Report | Status Code Report | File Size Report | File Type Report | Directory Report | Request Report)
Listing domains, sorted by the amount of traffic.
| #reqs | %bytes | domain |
|---|---|---|
| 32 | 100% | [unresolved numerical addresses] |
(Go To: Top | General Summary | Monthly Report | Daily Summary | Hourly Summary | Domain Report | Organization Report | Failed Referrer Report | Browser Report | Browser Summary | Operating System Report | Status Code Report | File Size Report | File Type Report | Directory Report | Request Report)
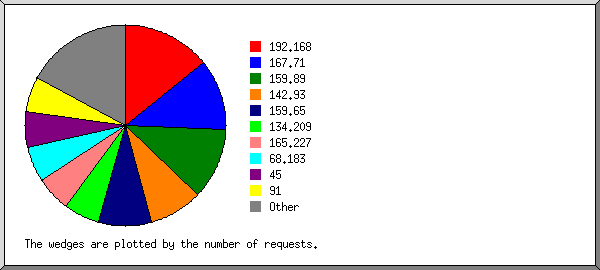
Listing organizations, sorted by the number of requests.
| #reqs | %bytes | organization |
|---|---|---|
| 5 | 6.11% | 192.168 |
| 4 | 1.50% | 167.71 |
| 4 | 32.21% | 159.89 |
| 3 | 1.12% | 142.93 |
| 3 | 11.36% | 159.65 |
| 2 | 0.75% | 134.209 |
| 2 | 10.99% | 165.227 |
| 2 | 10.99% | 45 |
| 2 | 2.62% | 91 |
| 1 | 0.37% | 159.203 |
| 1 | 10.61% | 104 |
| 1 | 0.37% | 68.183 |
| 1 | 0.37% | 209.97 |
| 1 | 10.61% | 160.152 |
(Go To: Top | General Summary | Monthly Report | Daily Summary | Hourly Summary | Domain Report | Organization Report | Failed Referrer Report | Browser Report | Browser Summary | Operating System Report | Status Code Report | File Size Report | File Type Report | Directory Report | Request Report)
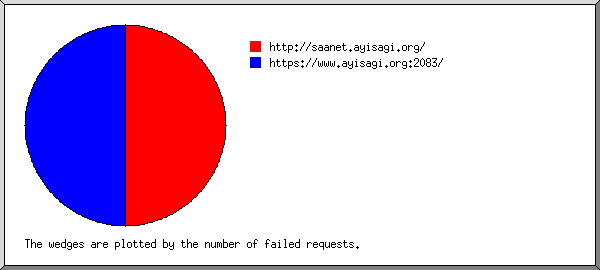
Listing referring URLs, sorted by the number of failed requests.
| #reqs | URL |
|---|---|
| 1 | http://saanet.ayisagi.org/ |
| 1 | https://www.ayisagi.org:2083/ |
(Go To: Top | General Summary | Monthly Report | Daily Summary | Hourly Summary | Domain Report | Organization Report | Failed Referrer Report | Browser Report | Browser Summary | Operating System Report | Status Code Report | File Size Report | File Type Report | Directory Report | Request Report)
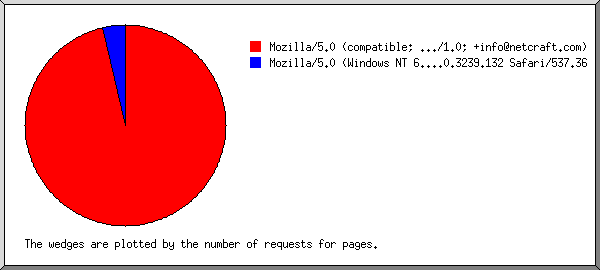
Listing browsers with at least 1 request for a page, sorted by the number of requests for pages.
| #reqs | #pages | browser |
|---|---|---|
| 24 | 24 | Mozilla/5.0 (compatible; NetcraftSurveyAgent/1.0; +info@netcraft.com) |
| 1 | 1 | Mozilla/5.0 (Windows NT 6.2; Win64; x64) AppleWebKit/537.36 (KHTML, like Gecko) Chrome/63.0.3239.132 Safari/537.36 |
| 7 | 0 | [not listed: 1 browser] |
(Go To: Top | General Summary | Monthly Report | Daily Summary | Hourly Summary | Domain Report | Organization Report | Failed Referrer Report | Browser Report | Browser Summary | Operating System Report | Status Code Report | File Size Report | File Type Report | Directory Report | Request Report)
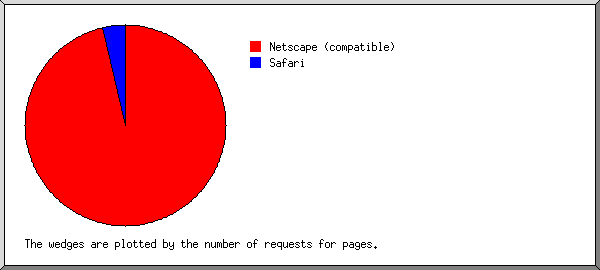
Listing browsers with at least 1 request for a page, sorted by the number of requests for pages.
| # | #reqs | #pages | browser |
|---|---|---|---|
| 1 | 24 | 24 | Netscape (compatible) |
| 2 | 1 | 1 | Safari |
| 1 | 1 | Safari/537 | |
| 7 | 0 | [not listed: 1 browser] |
(Go To: Top | General Summary | Monthly Report | Daily Summary | Hourly Summary | Domain Report | Organization Report | Failed Referrer Report | Browser Report | Browser Summary | Operating System Report | Status Code Report | File Size Report | File Type Report | Directory Report | Request Report)
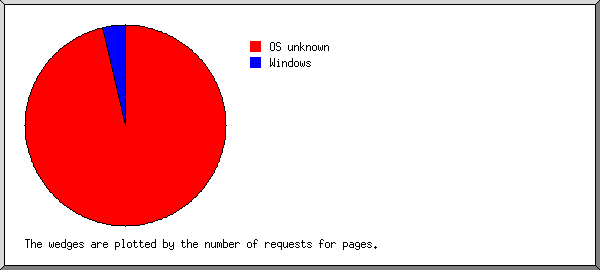
Listing operating systems, sorted by the number of requests for pages.
| # | #reqs | #pages | OS |
|---|---|---|---|
| 1 | 31 | 24 | OS unknown |
| 2 | 1 | 1 | Windows |
| 1 | 1 | Unknown Windows |
(Go To: Top | General Summary | Monthly Report | Daily Summary | Hourly Summary | Domain Report | Organization Report | Failed Referrer Report | Browser Report | Browser Summary | Operating System Report | Status Code Report | File Size Report | File Type Report | Directory Report | Request Report)
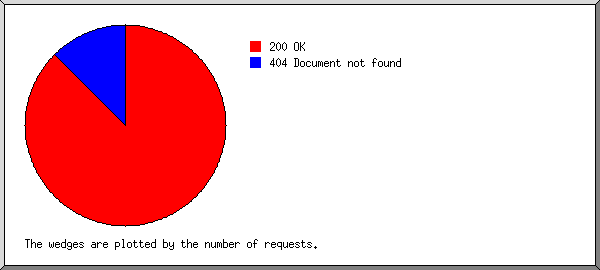
Listing status codes, sorted numerically.
| #reqs | status code |
|---|---|
| 32 | 200 OK |
| 5 | 404 Document not found |
(Go To: Top | General Summary | Monthly Report | Daily Summary | Hourly Summary | Domain Report | Organization Report | Failed Referrer Report | Browser Report | Browser Summary | Operating System Report | Status Code Report | File Size Report | File Type Report | Directory Report | Request Report)
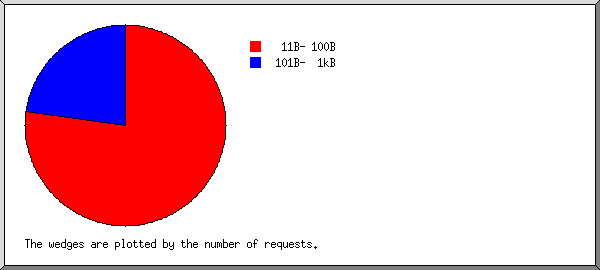
| size | #reqs | %bytes |
|---|---|---|
| 0 | 0 | |
| 1B- 10B | 0 | |
| 11B- 100B | 24 | 15.11% |
| 101B- 1kB | 8 | 84.89% |
(Go To: Top | General Summary | Monthly Report | Daily Summary | Hourly Summary | Domain Report | Organization Report | Failed Referrer Report | Browser Report | Browser Summary | Operating System Report | Status Code Report | File Size Report | File Type Report | Directory Report | Request Report)
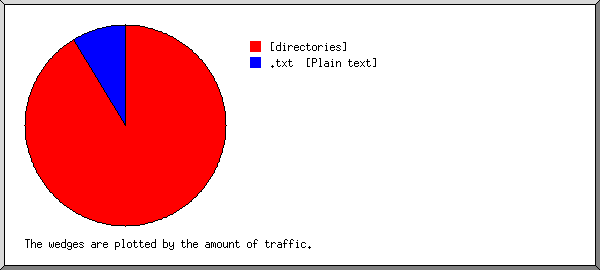
Listing extensions with at least 0.1% of the traffic, sorted by the amount of traffic.
| #reqs | %bytes | extension |
|---|---|---|
| 25 | 91.26% | [directories] |
| 7 | 8.74% | .txt [Plain text] |
(Go To: Top | General Summary | Monthly Report | Daily Summary | Hourly Summary | Domain Report | Organization Report | Failed Referrer Report | Browser Report | Browser Summary | Operating System Report | Status Code Report | File Size Report | File Type Report | Directory Report | Request Report)
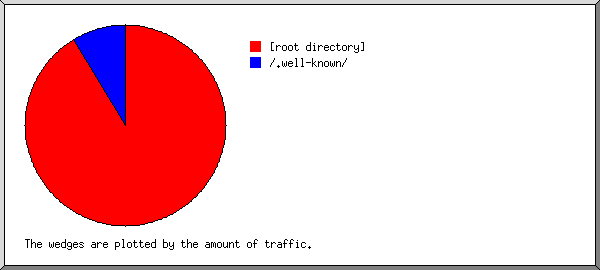
Listing directories with at least 0.01% of the traffic, sorted by the amount of traffic.
| #reqs | %bytes | directory |
|---|---|---|
| 25 | 91.26% | [root directory] |
| 7 | 8.74% | /.well-known/ |
(Go To: Top | General Summary | Monthly Report | Daily Summary | Hourly Summary | Domain Report | Organization Report | Failed Referrer Report | Browser Report | Browser Summary | Operating System Report | Status Code Report | File Size Report | File Type Report | Directory Report | Request Report)
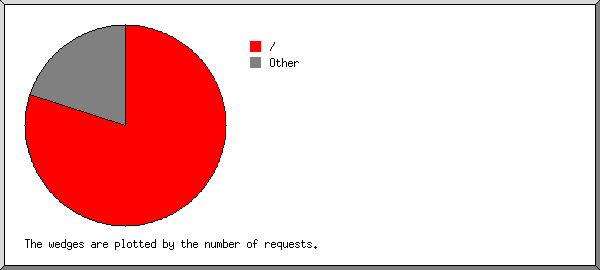
Listing files with at least 20 requests, sorted by the number of requests.
| #reqs | %bytes | last time | file |
|---|---|---|---|
| 25 | 91.26% | Sep/ 6/19 8:08 PM | / |
| 7 | 8.74% | Jul/26/17 9:19 AM | [not listed: 4 files] |